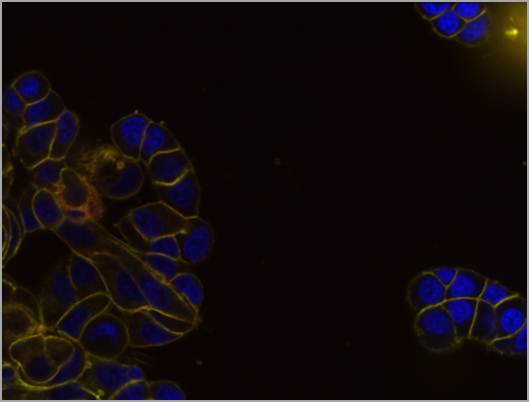
Fluorescence microscopy has been used for decades as an important tool for visualizing biochemical activity within individual cells. In the past however, analysis of these images were done manually through visual inspection leading to a time consuming and many a times inaccurate conclusion. This also made the process non scalable.
For higher throughput, such as in drug discovery process or RNAi screen, faster imaging, higher resolution and accurate data analysis will be required, which cannot be achieved by traditional methods of microscopy.
The advent of automated microscopy combined with powerful automated image analysis technique provided the solution. With the use of sophisticated robotics and powerful computation a large screen can be achieved within a few days.
High Content Analysis - HCA
High content analysis refers to the use of automated microscopy and high end computation to understand intricate and complex biological processes. This typically involves acquiring high resolution 2 dimensional or three dimensional images and translating them into a multiparametric feature space, which will be further processed by machine learning algorithms to provide relevant output. We use the term HCA for analysing few microwell plates (~20) while high content screening refers to the use of complete automation for analyzing data from large number of plates (50~1000)
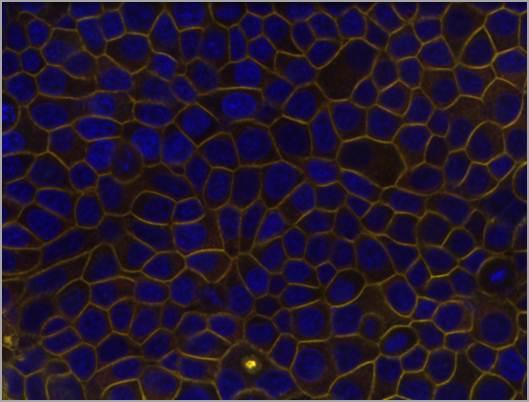
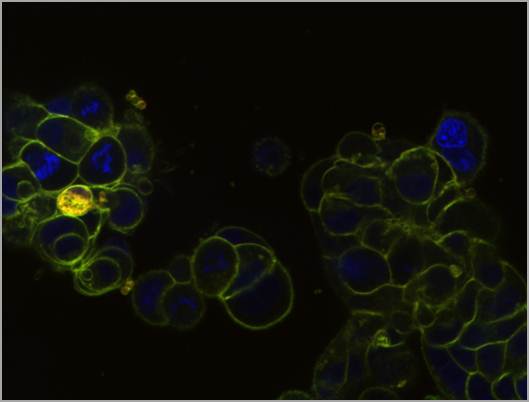
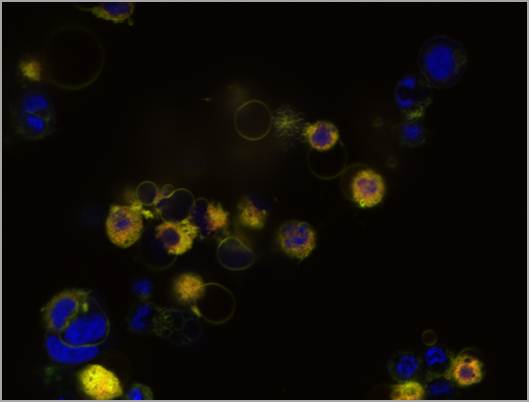
The imaging phase involves taking numerous high resolution multi spectral fluorescence images involving different biological conditions. These images are stored in our image database, which has a capacity to store 70TB of data.
The high resolution images acquired using automated microscopy are segmented to find individual cells in those images. Each cell is then given a deignation in a multiparametric space called the feature space using powerful high end software, based on their Intensity, Texture, Morphology and co-localization . Together the feature space spans approximately 250 features per fluorescence channel. This step is called Feature Extraction
Although many features are extracted during the feature extraction phase, not all of them are necessary for answering the biological question. This leads to the necessity to find appropriate subset of the features to represent the data adequately without much information loss. Feature reduction algorithms performs the task of mapping the dataset into a smaller feature space.
Once a meaningful representation is achieved, automated classification is performed on the entire data. Control conditions can be specified and samples from controls can be used to train the classifier. The classification software selectes the ideal combination of feature reduction algorithm as well as a classification algorithm automatically based on the data. For more information please visit the software page.
High Content Screening refers to the use of automated imaging and analysis techniques to test thousands of compounds or even large siRNA screen. This incorporates sophisticated robotics for complete automation from sample preparation to analysis. HCS typically involves three major steps, Plate Preparation, Imaging and analysis.
Plate Preparation - The Thermo SP-WorkCell robotic workstation has been configured to perform double-immunofluorescence staining on forty 384-well tissue culture plates in 8 hours. The system integrates a Thermo-CRS VAL 3-axis robot; a Hamilton Starlet with 96-tip and variable-span 8 tip heads; two ThermoFisher Multidrop Combi dispensers and two BioTek plate washers.
Imaging - Automated fluorescence microscopy has been proven to be a very useful tool in understanding the complexity of the cell. At our lab, we are in a constant process of finding out new ways for efficient fluorescence imaging along with state of the art analysis. Our current list of imaging techniques ranges from deconvolution microscopy, multiphoton microscopy, spinning disk confocal microscopy. Our instrumentation list includes:
Opera High Content Imaging System is a sophisticated spinning disk autoated microscope with a capability of multichannel parallel acquisition. With an automated stage and the ability to take multiple multi channel images of approximately 100 plates per day, this constitutes one of the best automated fluorescence microscope. For more details regarding the Opera™ please click here. In addition to fluorescence imaging, our Opera microscope has a high speed camera with pulse laser excitation to carry out fluorescene life time imaging.
Data Storage - Columbus Data Management In addition to the tremendous data acquisition capability, our servers have the capability to store tera bytes of data through the Columbus data management system from PerkinElmer. For more details about the Columbus form the PerkinElmer website click here.
Image Analysis/Feature Extraction - Feature extraction involves extracting relevant features from the fluorescence micrograph through the use of image segmentation. A variety of features are extracted for each channel. They are broadly classified as "Morphology", "Intensity", "Texture" and "Colocalization". Details of the features can be found here. The script is developed using Acapella(Perkin Elmer) script.
Subtracts the mean intensity of the background from an image. The background is assumed to be the area outside the user-defined object list. By Karsten Kottig,
Evotec. NEW: Also includes a Rolling Ball
like algorithm for background correction.
Illustrates how to:
- generate stencils of different
subcellular compartments
- calculate mean intensity of
different compartments
- calculate the ratio of two
compartments